
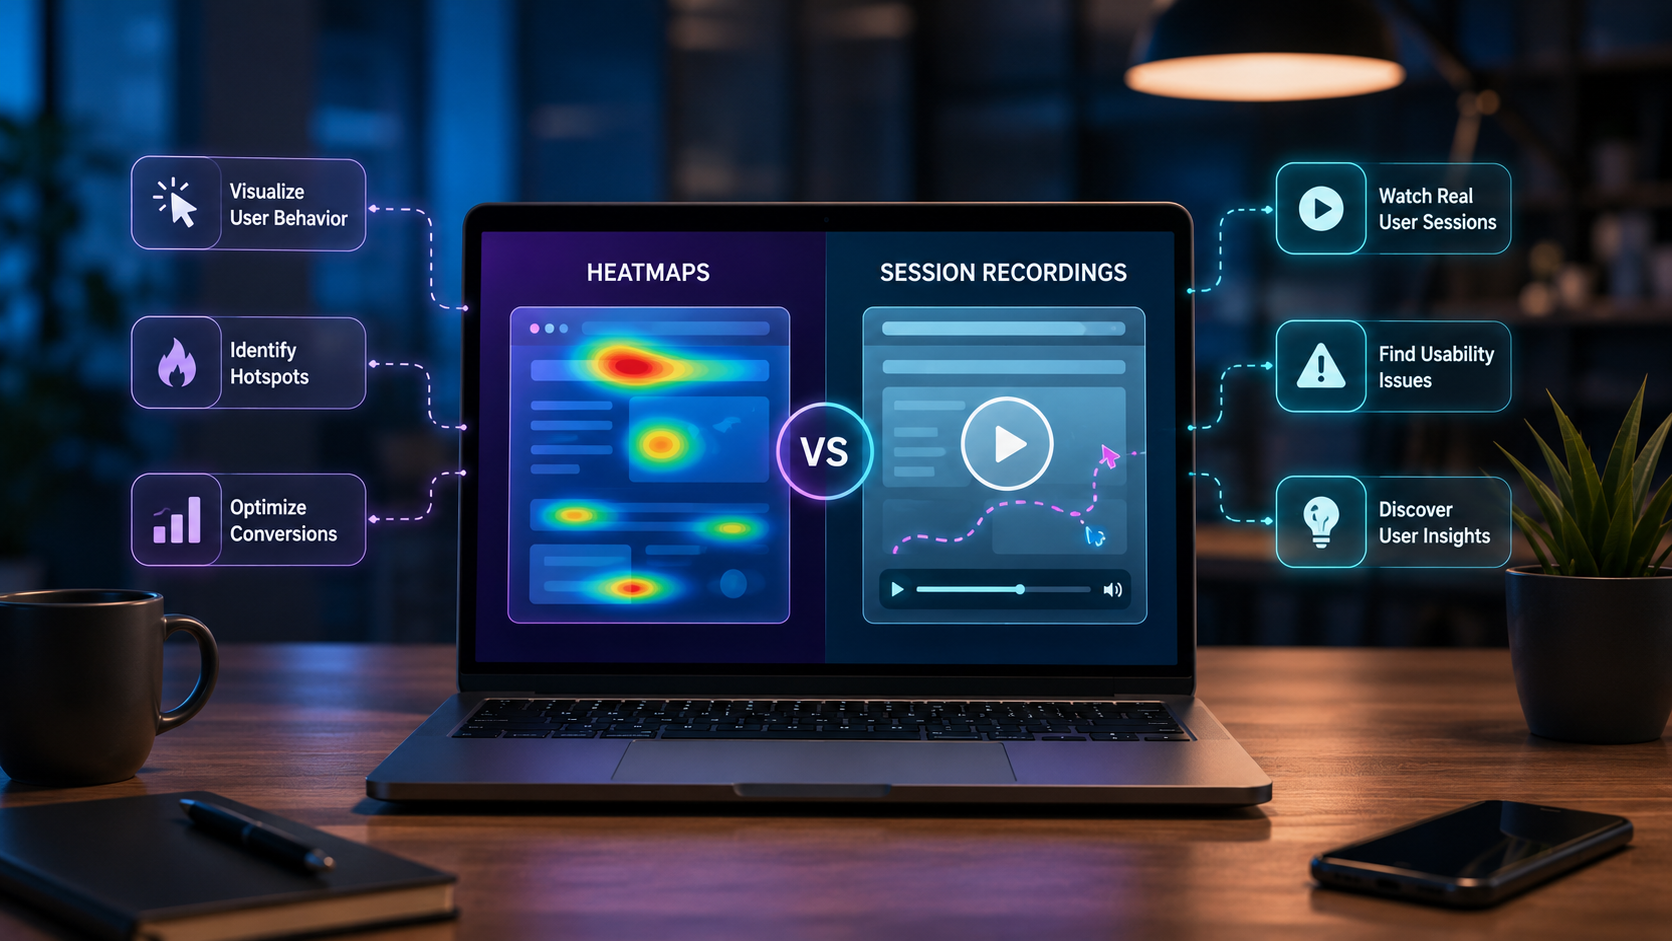
Heatmaps and session recordings get bundled into the same “behavioral analytics” category, and most SMB teams install both, look at both once, and never build a repeatable workflow around either. This guide is for product managers, marketers, and founders who want a clear rule for which tool to reach for first, how much traffic you actually need before trusting what you see, and how to use the two together instead of picking one and ignoring the other.
Quick Answer: Heatmaps or Session Recordings?
Use a heatmap when your question starts with “what are most visitors doing” — CTA placement, scroll depth, aggregate attention on a page. Use a session recording when the question starts with “why did this specific visitor drop off.” Heatmaps need roughly 2,000-3,000 recorded sessions per page before patterns are reliable; below that, filter straight to recordings instead of trusting a noisy map.
What a Heatmap Actually Shows You
A heatmap aggregates behavior from many sessions into a single color-coded overlay on your page. The three types that matter for most SMB sites: click maps (where visitors click or tap, including on non-interactive elements that visitors mistakenly think are clickable), scroll maps (how far down a page visitors actually read, revealing whether your key content sits below a “false bottom”), and move or attention maps (where the cursor hovers, a rough proxy for visual attention on desktop). A heatmap tells you what happened and where. It never tells you why — it flattens hundreds of different individual stories into a single aggregate image, so a button that gets clicked by confused visitors looks identical to one clicked by satisfied ones.
What a Session Recording Actually Shows You
A session recording — also called session replay — reconstructs one visitor’s complete journey: mouse movements, clicks, scrolls, typing, hesitation, and page navigation, played back like a video. It isn’t a literal screen recording; it’s rebuilt from the actual DOM events the browser captured, which is why it can be replayed even on devices that were never recorded on video. This is an investigative tool, not a monitoring one — watching recordings at random without a specific question is one of the least efficient ways to spend CRO time, since you mostly end up confirming assumptions you already had rather than discovering what you didn’t know.
The Core Difference: Aggregate vs Individual
| Heatmap | Session Recording | |
|---|---|---|
| Answers | What are most visitors doing | Why did this visitor do that |
| Scope | Aggregate, hundreds-thousands of sessions | Individual, one session at a time |
| Minimum data for reliability | ~2,000-3,000 sessions/page | 10-15 filtered recordings of the same pattern |
| Best for | Layout decisions, CTA placement, above-the-fold content | Debugging funnel drop-off, form abandonment, rage clicks |
| Typical workflow position | First — find the pattern | Second — confirm the mechanism |
When to Reach for a Heatmap First
- You’re deciding where to place a CTA, image, or piece of content on a high-traffic page and want data instead of a guess.
- You want to compare desktop vs mobile attention zones on the same page — these are frequently very different and worth checking before a redesign.
- You want a fast, shareable visual for stakeholders who won’t sit through session recordings but will understand a red-blue overlay in five seconds.
- You’re validating whether a recent layout change actually shifted behavior — heatmap comparison mode across two date ranges is faster than watching dozens of before/after recordings.
When to Reach for Session Recordings First
- Your traffic is healthy but conversions aren’t moving, and you don’t know what’s stopping people — this is the single clearest trigger for pulling up recordings.
- You already have a specific, well-defined question, like “why do mobile visitors abandon on the shipping form.”
- A funnel report shows a specific step losing users and you need to see the mechanism, not just the number.
- You’re chasing a bug report or support ticket and need to reproduce exactly what a user experienced.
The Diagnostic Workflow: Using Both Together
The teams that get the most out of behavioral analytics don’t pick one tool — they run a sequence. Start with funnel analysis (your GA4 ecommerce events or key event data) to find where in the journey users are actually dropping off. Pull up a heatmap on that specific page to spot the pattern — a scroll map showing 70% of visitors never reach your CTA, or a click map showing clicks piling up on a non-interactive image. Then filter session recordings down to visitors who match that exact pattern — same page, same behavior, same device type if relevant — and watch 10 to 15 of them. A repeating pattern across that many sessions is a real signal; three rage clicks across three sessions might just be coincidence. Form a specific, testable hypothesis from what you watched, ship the fix, then re-run the heatmap to confirm behavior actually shifted.
How Much Traffic You Actually Need
A heatmap built on too little traffic is decorative, not diagnostic. The general guidance is at least a few hundred sessions before click and scroll patterns start meaning anything, and roughly 2,000-3,000 recorded sessions per page before finer patterns stabilize. If a page gets fewer than 200 sessions a week, treat any heatmap on it as noise and go straight to recordings or a small round of moderated usability testing instead. This matters a lot for SMB sites: a homepage or top landing page hits that threshold fast, but a seasonal campaign page or a low-traffic blog post may never accumulate enough sessions to heatmap reliably — don’t force a heatmap where the sample size can’t support one.
The Tool Landscape in 2026
The category has consolidated. Hotjar is now part of Contentsquare, and its features were split into three separately billed modules — Experience Analytics (heatmaps and recordings, from $49/month), Voice of Customer (surveys, from $99/month), and Product Analytics (custom pricing) — so teams that budgeted for one Hotjar line item now need to model three. Microsoft Clarity remains 100% free at any traffic volume and covers the core heatmap and recording use cases well enough that most SMBs starting out should install it before paying for anything. Smartlook reached end-of-sale on May 31, 2026, following Cisco’s acquisition and its integration into AppDynamics — teams still running it need a migration plan now, not later. For a full breakdown of where each tool actually wins, see our Hotjar vs Clarity vs LogRocket comparison.
The Bot Traffic Problem Nobody Mentions
We flagged this same issue analyzing our own Search Console data: a meaningful share of “sessions” hitting a site in 2026 aren’t human visitors at all, they’re AI crawlers and scraping bots, and most heatmap and session recording tools have no upstream filter for this. A rage-click cluster on your checkout button might be real customer confusion — or it might be a headless browser bot failing to navigate a JavaScript-rendered form. If your heatmap tool records everything the browser sends without bot filtering, your “aggregate pattern” from 3,000 sessions might actually represent far fewer real humans than the count suggests. Before trusting a heatmap pattern enough to redesign around it, sanity-check the traffic source mix for that page — if a large share is coming from data-center IPs or known crawler user agents, filter those sessions out before reading anything into the pattern.
Common Ways Teams Misread the Data
Confusing click density with conversion contribution is the most common heatmap mistake: a click map that lights up bright red on your social icons isn’t a success signal, it’s a distraction signal — visitors are clicking away from the purchase decision, not toward it. Red doesn’t mean good, it means something is getting clicked, and whether that’s good depends entirely on what it is. On the recording side, the equivalent mistake is watching sessions without a hypothesis: pulling up 50 random recordings and looking for “something interesting” burns an afternoon and usually just confirms whatever you already believed. Always filter first — by page, by behavior, by device, by traffic source — and only then start watching. Not segmenting by device is a third common gap: mobile and desktop attention zones are frequently very different on the same page, and a single unsegmented heatmap will average the two into a pattern that describes neither audience accurately.
Where Form Analytics Fits In
Neither a standard click heatmap nor a raw session recording is built to answer “which specific form field is causing abandonment” efficiently on its own — you’d need to watch dozens of recordings just to spot the pattern manually. Form analytics, offered as a bundled feature in tools like Mouseflow and Lucky Orange (though sold as a separate add-on in Hotjar’s post-Contentsquare split), tracks field-level metrics directly: time spent per field, which fields get abandoned most, and how many attempts a field takes before submission succeeds. If form abandonment specifically is your problem, check whether your chosen tool includes form analytics before relying purely on heatmaps and manual recording review to diagnose it — it will get you to the answer significantly faster than either tool alone.
Privacy and Consent Considerations
Session recordings capture form inputs, so masking sensitive fields (passwords, payment details, personal data) is not optional — every tool worth using offers field-level masking, and it should be on by default for any field collecting PII. Both heatmaps and session recordings fall under the same cookie consent requirements as your other analytics tags: they should only fire after a visitor consents, following the same consent-aware setup you’d use for GA4 form tracking. If you serve EU or UK traffic, confirm your CMP blocks the heatmap/recording script pre-consent the same way it blocks your other marketing and analytics tags — a separately-installed heatmap script is a common place for consent gaps to slip through unnoticed.
Frequently Asked Questions
Do I need both heatmaps and session recordings, or can I pick one?
Most modern tools (Hotjar, Clarity, Mouseflow, LogRocket) include both in the same subscription, so there’s rarely a reason to run only one. Heatmaps find the pattern; recordings explain the mechanism behind it — they’re complementary, not competing, tools.
How many session recordings should I watch before drawing a conclusion?
At least 10 to 15 recordings showing the same pattern. Three examples of the same behavior might be a coincidence; ten or more gives enough density to separate a real, fixable issue from one-off user error.
How much traffic do I need before a heatmap is reliable?
Roughly a few hundred sessions as a bare minimum, with patterns stabilizing around 2,000-3,000 recorded sessions per page. Pages under 200 sessions a week will produce a noisy, unreliable map — treat it as decorative, not diagnostic.
Is Microsoft Clarity actually good enough, or do I need Hotjar?
For most SMBs, functionally yes — Clarity is free at any traffic volume and covers the core heatmap and recording use cases. Hotjar’s (now Contentsquare’s) paid tiers add polish, surveys, and deeper integrations that matter at scale, but starting with Clarity and upgrading only when you hit a specific feature gap is the more common path.
Can heatmaps or session recordings replace GA4?
No. GA4 tells you what happened in aggregate numbers — conversion rates, funnel drop-off, traffic sources. Heatmaps and session recordings show you the visual and behavioral “why” behind those numbers. Most teams run GA4 for measurement and layer a heatmap/recording tool on top specifically for diagnosis.
Do session recordings slow down my website?
Modern recording scripts are lightweight and asynchronous, so the impact is usually minimal, but it’s not zero — on already slow sites, an additional tracking script can measurably affect Core Web Vitals. Load it via a tag manager rather than hardcoding it, so it can be paused or removed quickly if it becomes a performance issue.